


Fluorescence Spectroscopy
Background
The first step in molecular fluorescence is the absorption of light energy by a molecule. The molecule "accommodates" this additional energy by promoting electrons to higher (excited) energy levels. The additional energy can be released in several different ways. The molecule could lose some of the energy through enhanced vibrations (red squiggly line). Fluorescence occurs when the molecule releases that remainder of that excess energy by emitting light. Because some energy is lost to molecular vibration in between the absorbance and emission processes, fluorescence usually occurs at lower energy (higher wavelength) than the absorbance.
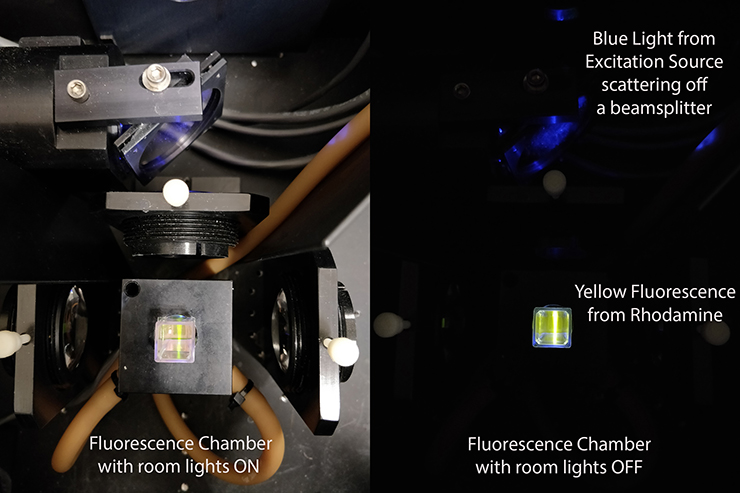
In the image to the right, you are looking down into the chamber of a fluorescence spectrometer. In one image the room lights are on so you can some of the optics. A sample of rhodamine is being bombarded with blue light from a lamp. Rhodamine absorbs some of that blue light, then emits yellow light. That yellow fluorescence is much easier to see with the room lights off.
Fluorescence Instrumentation
Photon Technology International QuantaMaster Fluorescence Spectrometer
The modular design of the QuantaMaster offers flexibility in orientation, and the dual-emission monochromators provide access to an array of steady-state fluorescence techniques. This instrument is equipped with polarizers to obtain information regarding the speed of molecular rotations, a 4-position automated sample holder to increase productivity, and fiber optic chucks on the excitation and emission monochromators. A HeCd laser can be directed into the sample chamber in place of the usual Xe arc lamp.
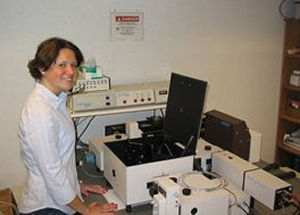
Partial Key to PTI C-61 Diagram 1: Xe Arc Lamp (excitation source) 3: Excitation Monochromator(selects ex wavelength) 8: Sample Holder 11: Emission Monochromators (selects fluorescence wavelength) 12: Photomultiplier Tube Detectors
Changes in fluorescence emission spectra provide information regarding the binding of a fluorescent molecule, PRODAN, to the trash-can shaped cavity of gamma-cyclodextrin.
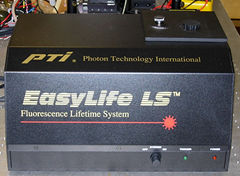
Photon Technology International EasyLife Lifetime Fluorometer
The EasyLife fluorometer is used to measure fluorescence lifetimes. Basically, that is the time lag between absorption and emission of photons. In this technique, the sample is repeatedly excited with a brief pulse of light; then, fluorescence intensity is measured various times after that pulse. In order to conceptualize this approach, think about how a glow-in-the-dark toy becomes dimmer in the minutes after it is held against a light source. Glow-in-the-dark toys exhibit phosphorescence which occurs on a much longer time scale. In the easyLife the delay between the pulse and the intensity measurement is on the order of nanoseconds, or billionths of seconds. Fluorescence lifetimes provide additional details regarding molecular environments and interactions when used in concert with steady-state techniques (where the light source is on continuously).
Change in the fluorescence lifetime when Ruthenium(II) tris(2,2'-bipyridine) is embedded within a metal-organic framework.
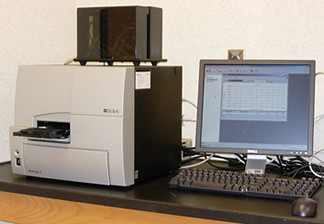
BioTek Synergy 2 Plate Reader
The Synergy 2 Plate Reader is capable of measuring both absorbance and fluorescence of many samples in a fast, automated fashion that requires very little sample amounts. We typically use plates with 96 separate compartments, so we can analyze up to 96 samples at a time. This instrument is primarily used in our biochemistry laboratories to quantify proteins and assess enzyme activity.
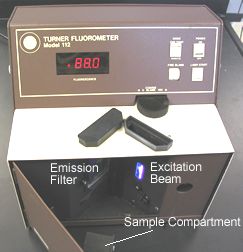
Turner Model 112 Fluorimeter
The Turner Model 112 is an inexpensive filter fluorometer from the early 1980s. Instead of using monochromators to select the excitation or emission wavelengths, this instrument uses filters. This lowers the cost dramatically and has the ability to allow more photons to reach the detector. This particular instrument is in excellent shape and can detect quinine in tonic water at the part per trillion range. It comes in handy if there is a backlog of students waiting to make intensity measurements on the PTI Quantamaster.
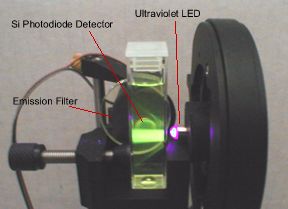
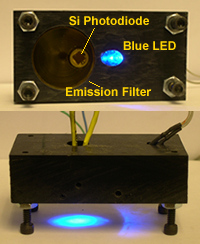
Homemade Fluorometers
A few student projects have involved the construction of simple, inexpensive fluorometers. These fluorometers are based on LEDs for excitation sources, and silicon photodiodes for detectors. Students apply basic principles of electronic circuit construction and using LabView software to create user interfaces to control the measurement process from these simple instruments.