


Spartan Modeling Software
Examples from KU undergraduate courses
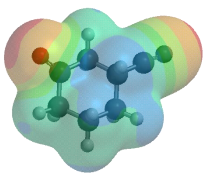
Calculated electron density for an aromatic molecule
Computational software programs, such as Spartan allow for the visualization of many of the core concepts in chemistry. This software is utilized in a variety of courses throughout the curriculum. Periodic trends such as electronegativity can be understood by seeing the red color indicating high electron density around more electronegative atoms in a molecule and blue color in electron deficient locations, as shown at left. In addition, the 3-dimensional shape of molecules is apparent when these molecules are calculated, helping to solidify the VSEPR (Valence Shell Electron Pair Repulsion) theory of chemical structure in the mind of students.
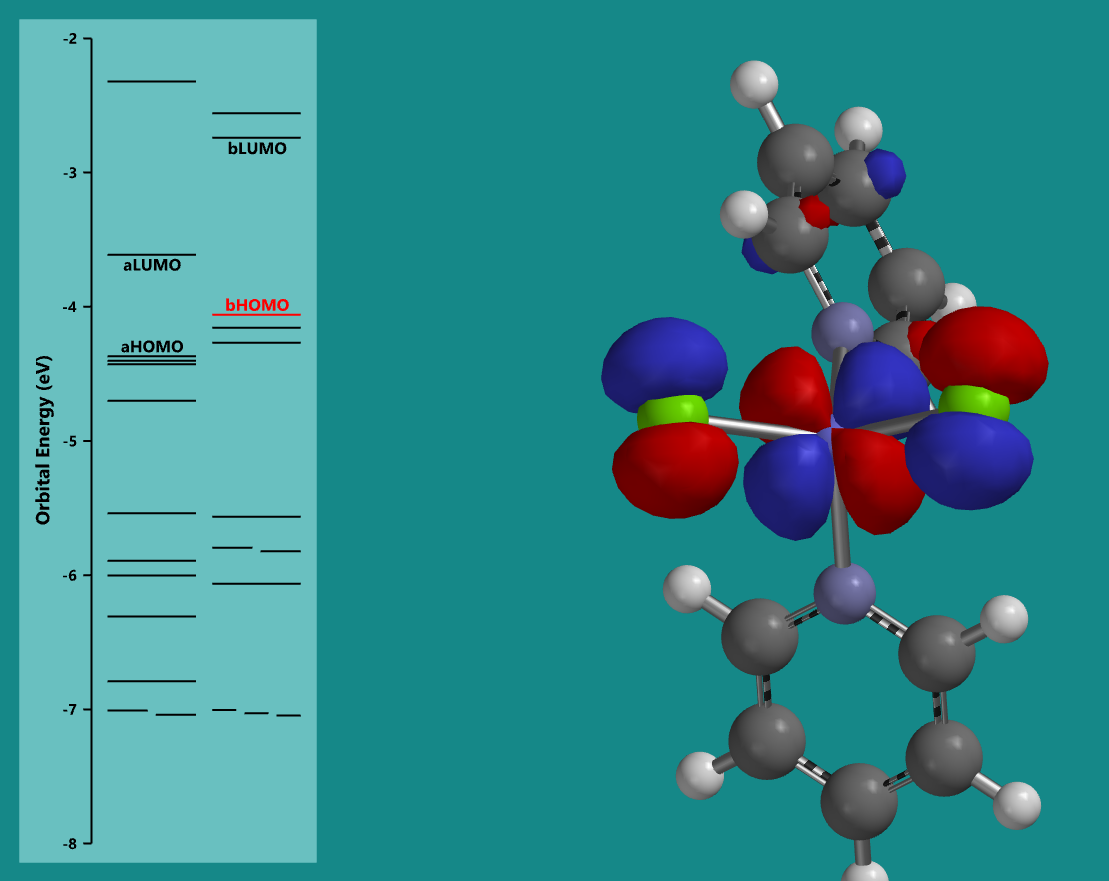
Molecular orbital diagram for Co(pyridine)2Cl2
Calculations can also provide intuition as to where electrons reside on a molecule. Shown at the left is a depiction of the calculated highest occupied molecular orbital for a molecule, with the electron calculated to reside primarily around three atoms within the molecule (a cobalt atom in the center and two chloride atoms bonded to it). These visualizations help us to understand the uncertain nature of the location of electrons and how they often do not simply appear near only one atom in a molecule, but can be shared over many atoms. Additionally, these orbital diagrams provide insight into the electronic transitions observed in UV-Vis spectroscopy.
Spartan Calculations for visualization of IR stretches and bends